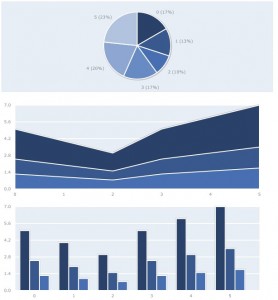
I have a number of projects rattling around where I’ll likely need to write up some good looking graphs in JavaScript. The following is a brief list and description of the available graphing libraries I’ve found for JavaScript. Hopefully this’ll help you as much as it’ll help me!![]()
Bluff
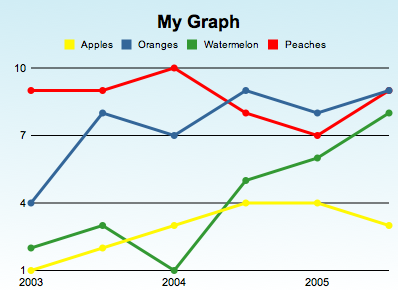
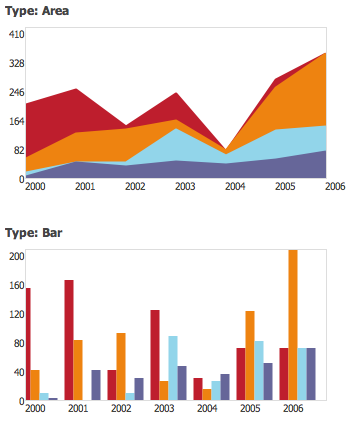
Bluff is the most recent graphing library I’ve heard of, so it gets top spot on the list. Prints out some pretty results and is cross browser compliant (as long as you also use ExCanvas for IE). Screenshot below:
Flot
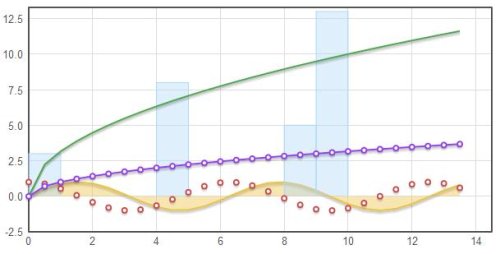
The Flot jQuery plugin is next up, and so far the prettiest option I’ve found. Flot also relies on ExCanvas.
Plotr
The Plotr library is built on top of Prototype, and, of course, has equal reliance on ExCanvas.
Sparklines
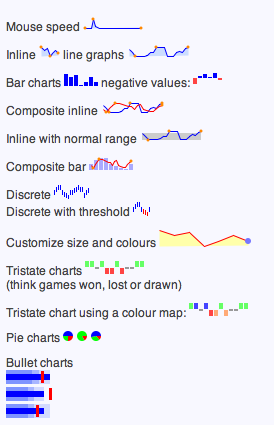
Sparklines jQuery plugin is so cute I’m just itching for an excuse to use it. Instead of “full sized” graphs, Sparklines gives you little bitty mini-graphs.
fgCharting
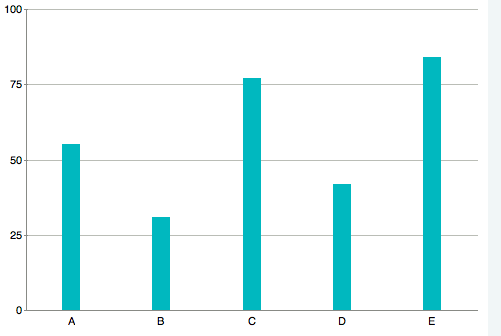
The Filament Group released their fgCharting jQuery plugin earlier this year. While graphs in other libraries may look a bit better (Flot?) fgCharting ties your graph to a <table> of data, and editing the values in the table will update the graph in real time. Sexy stuff.
YUI Charts
I’ll be honest, the most underwhelming option so far is YUI Charts. Mind you – this is based entirely upon the default theme of the graph. Presumably you could style your graphs to look a bit better (one would certainly hope so!), and their API is far from lacking.
Timeplot
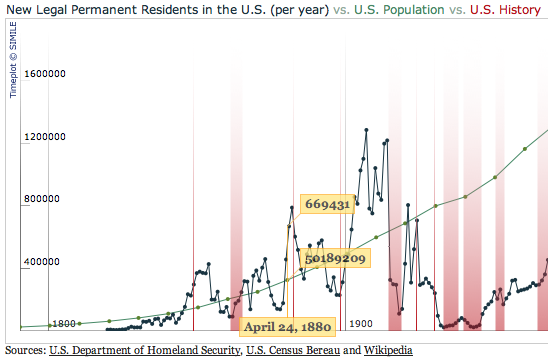
The next two libraries make me want to code my own finance site just so I can use their library. First up is Timeplot, and I demand that you visit the site and check out the demo.
Timepedia
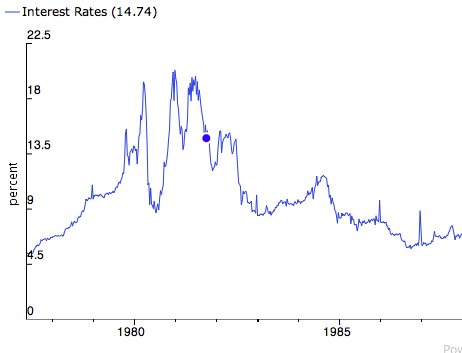
Equally brilliant is Timepedia. Visit the site, mouse over the graph, and scroll your mouse. Behold how quickly and smoothly a data set with over 16000 data points loads and zooms.
PlotKit
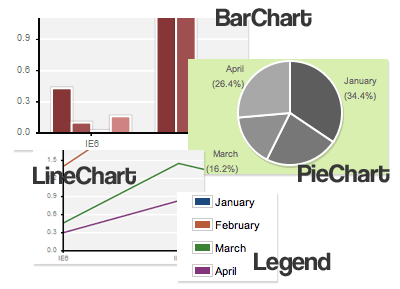
PlotKit is the last library I’ll mention, and it also relies on the ExCanvas library for full browser support. It’s well documented, easy to use, and the result is clean and elegant.
Summary
There is tons of choice when it comes to choosing a graphing library for your app, and I’m sure I even missed a few options. There is such huge potential for building incredibly rich apps in JavaScript – even just a few years ago none of this was possible. It’s certainly a good day to be a web app programmer ![]()
